List of "biological primitives"/bionumbers in aging (and ways to measure them)

https://www.ncbi.nlm.nih.gov/pmc/articles/PMC1838666/#!po=24.2188


In flies, loss of function mutations in genes encoding components of Polycomb Repressive Complex 2 (PRC2)—an H3K27me3 specific methyltransferase complex—result in decreased levels of H3K27me3 and increased lifespan

PTM crosstalk relevant to longevity is histone bivalency where two histone PTMs that normally oppose each other (H3K4me3 and H3K27me3) act synergistically in combination to promote a unique intermediate state of chromatin that appears “poised” for gene activation

SIRT6 T294 phosphorylation site is particularly interesting given the role of SIRT6 in regulating lifespan. A more thorough phylogenetic analysis of T294 reveals that it is only present in a few long-lived groups such as old-world primates, cetaceans, beavers, tree squirrels, as well as David’s myotis bat; however, the majority of mammals appear to lack this site. Consistent with its potentially important role, phosphorylation of T294 is the most highly observed modification of human SIRT6 (cataloged in the PhosphoSitePlus database);[94] yet, several studies failed to reveal its role. T294 resides outside of the highly conserved sir-tuin catalytic domain within a proline-rich region that bridges to a less conserved C-terminus that may facilitate protein–protein interactions.[95] Substitution of T294 with glutamic acid (T294E) that in many cases would mimic a constitutive phosphorylation did not affect SIRT6 nuclear (or nucleolar) localization.[96] Similarly, alanine substitution (T294A) did not reduce SIRT6’s ability to stimulate DNA repair after oxidative stress

Since PTMs are not directly genetically encoded, engineering these features in vivo was beyond reach until recently. Novel engineering strategies such as protein ligation/splicing, non-natural amino acid mutagenesis, or inactive CRISPR/Cas9-fusion protein-based localization of epigenetic modifiers may permit the engineering of designer PTMs/proteoforms in vivo.[104] We expect that future proteomics studies of longevity will incorporate these approaches to correlate PTMs/proteoforms with lifespan.

Moreover, an AP site is a location in DNA that has neither a purine or a pyrimidine base due to DNA damage, they are the most prevalent type of endogenous DNA damage in cells. AP sites can be generated spontaneously or after the cleavage of modified bases, like 8-OH-Gua

Moreover, oxidative DNA damage like 8-oxo-dG contributes to carcinogenesis through the modulation of gene expression, or the induction of mutations.[54] On the condition that 8-oxo-dG is repaired by BER, parts of the repair protein is left behind which can lead to epigenetic alterations, or the modulation of gene expression

The term G4 DNA was originally reserved for these tetramolecular structures that might play a role in meiosis.[5] However, as currently used in molecular biology, the term G4 can mean G-quadruplexes of any molecularity. Longer sequences, which contain two contiguous runs of three or more guanine bases, where the guanine regions are separated by one or more bases, only require two such sequences to provide enough guanine bases to form a quadruplex. These structures, formed from two separate G-rich strands, are termed bimolecular quadruplexes. Finally, sequences which contain four distinct runs of guanine bases can form stable quadruplex structures by themselves, and a quadruplex formed entirely from a single strand is called an intramolecular quadruplex.[17]

#bionumbers
Guanine (G) bases in G-quadruplex have the lowest redox potential causing it to be more susceptible to the formation of 8-oxoguanine (8-oxoG), an endogenous oxidized DNA base damage in the genome. Due to Guanine having a lower electron reduction potential than the other nucleotides bases,[53]8-oxo-2’-deoxyguanosine (8-oxo-dG), is a known major product of DNA oxidation

#DNArepair
AP site damage was found to be predominant in PQS regions of the genome, where formation of G-quadruplex structures is regulated and promoted by the DNA repair process, base excision repair (BER).[49] Base excision repair processes in cells have been proved to be reduced with aging as its components in the mitochondria begin to decline, which can lead to the formation of many diseases such as Alzheimer’s disease (AD).[50] These G-quadruplex structures are said to be formed in the promoter regions of DNA through superhelicity, which favors the unwinding of the double helical structure of DNA and in turn loops the strands to form G-quadruplex structures in guanine rich regions.[51] The BER pathway is signalled when it indicates an oxidative DNA base damage, where structures like, 8-Oxoguanine-DNA glycosylase 1 (OGG1), APE1 and G-quadruplex play a huge role in its repair. These enzymes participate in BER to repair certain DNA lesions such as 7,8-dihydro-8-oxoguanine (8-oxoG), which forms under oxidative stress to guanine bases.[52]


https://sci-hub.st/https://www.nature.com/articles/s41591-020-01182-9

). The cellular turnover time
is defined based on cell death and not on cell differentiation. For
example, in our analysis of blood cells, we included their time as
undifferentiated progenitors in their overall cell lifespan (Methods).
We found that the total turnover rate of the human body is
0.33 ± 0.02 × 10¹² (330 ± 20 billion) cells d−1 (equal to about 4million
cells s−1). About 86% of these cells are blood cells, mostly of bone
marrow origin. Almost all of the remaining 14% are gut cells. The
three major contributors to the cellular turnover of the human body
are jointly responsible for about 96% of the total turnover: eryth -
rocytes (RBCs), neutrophils and intestinal and stomach epithelia.

Interestingly, proteins enriched in the insoluble fraction of
CMA-deficient brains display a 20-fold higher supersaturation
score indicating that they are part of the metastable proteome
(the one at risk of aggregation). Furthermore, we noted that
proteins containing KFERQ-like motifs are at higher risk of
misfolding, indicating a tight relationship between the col-
lapse of the metastable proteome and CMA deficiency. These
findings support the idea that the protein inclusions observed
in the brains of CKL2A-/- mice originate from the inability to
timely degrade soluble forms of prone-to-aggregate proteins
that leads to their subsequent precipitation.

The properties of the residues that constitute the motif, rather than the specific amino acids, determine whether the CMA-targeting chaperone HSC70 can bind to this region9. The motif is always flanked by a glutamine on one of the sides (as the pentapeptide functions as a targeting sequence in both directions) and contains one or two of the positive residues K and R, one or two of the hydrophobic residues F, L, Ior V andone of the negatively charged E or D residues. Approximately 40% of proteins in the mammalian proteome contain a canonical KFERQ-like motif. In addition, in some substrate proteins, the same targeting motif can be generated through post-translational modifications, thus expanding the number of potential CMA substrates. Phosphorylation of S, T or Y present in a motif containing only four of the canonical residues and missing the negatively charged one can complete the motif and convert the protein to a CMA substrate2326. In some instances, Q can be replaced by K, which upon acetylation acquires properties similar to Q, thus completing the motif 27,28. Ubiquitylation or acetylation of the same K could, in theory, become a switch between proteasomal and lysosomal degradation. Characteristics of canonical or putative CMA motifs and recommendations for motif validation are described in Box 1.

https://www.ncbi.nlm.nih.gov/books/NBK9879/

effects of protein crowding - https://www.pnas.org/content/117/46/28614

Strikingly, amphisomes displayed the similar motility pattern: reduced retrograde (18.04% ± 1.74%), but not anterograde transport in the same axons of AD neurons (Figure 2F,G). We also quantified the average retrograde velocity and run length of Rab7-marked organelles in WT and hAPP mutant neurons (Figure 2H). Consistent with previous studies (Castle et al., 2014; Deinhardt et al., 2006), the average retrograde velocity and run length of Rab7-associated LEs in WT neurons were 0.40 ± 0.01 μm/sec and 56.97 ± 2.02 μm, respectively, which were significantly reduced in AD neurons (velocity: 0.10 ± 0.007 μm/sec, p<1×10⁻¹⁴; run length: 17.95 ± 1.18 μm, p<1×10⁻¹²). Altogether, these observations indicate that aberrant accumulation of amphisomes in distal AD axons may result from impaired retrograde transport. Moreover, we showed increased levels of APP (2.05 ± 0.29; p=0.015952) and C99 (6.13 ± 1.07; p=0.008705), but not C83 (1.18 ± 0.10; p=0.16055) in mutant hAPP Tg neurons relative to those of neurons from WT littermates (Figure 2—figure supplement 1C,D).

We also examined the co-localization of LC3 with Rab5-labeled early endosomes in cultured neurons from mutant hAPP Tg mice. We found that about 46% of LC3-labeled AVs co-localized with early endosomes within the axon of mutant hAPP neurons (45.58% ± 2.24%; n = 47, v = 875) (Figure 2—figure supplement 1H). However, Rab5-marked early endosomes moved either a short distance, or in an oscillatory pattern along axons (Figure 2—figure supplement 1I). While our observation is consistent with the results from previous studies (Cai et al., 2010; Chen and Sheng, 2013), the motility of axonal early endosomes showed no significant change in mutant hAPP neurons relative to that of WT neurons (WT: 67.53% ± 1.97; hAPP: 70.93% ± 2.31%; p=0.268) (Figure 2—figure supplement 1J). A recent study reported that nascent AVs gain retrograde transport motility by recruiting LE-loaded dynein-Snapin motor-adaptor complexes after fusion with Rab7-associated LEs to form amphisomes (Cheng et al., 2015a, 2015b). Thus, our data supports the notion that fusion of AVs with Rab5-endosomes could be a transitional process before they further mature into Rab7-positive amphisomes to gain long-distance retrograde transport motility.

RNA and proteins:

We find that for a narrow window around this length, the rate-limiting step is both thermodynamically favorable and relatively fast (Fig. 2D, Bottom). Beyond 100 amino acids, this step becomes dramatically slower. By length 112, this rate has decreased by roughly 1,000-fold, and by the time the monomer is fully synthesized (144 amino acids [AAs]), the rate has decreased by roughly 2,000-fold relative to the 100-AA partial chain. This slowdown far exceeds what is predicted from general scaling laws of folding time as a function of length (1, 3537). For instance, the power-law scaling proposed by Gutin et al. (36), τ∼L4, predicts only an ∼4-fold slowdown between lengths 100 and 144 AA. The discrepancy between this general scaling and our observed dramatic slowdown suggests that factors specific to MarR are at play. One possibility is nonnative intermediates. To test this hypothesis, we turned off the contribution of nonnative contacts to the potential energy by rerunning simulations in an all-atom Gō potential in which only native contacts contribute (38, 39). In stark contrast to the full knowledge-based potential (Fig. 3A, Left), the native-only potential predicts that, below the melting temperature, the full protein folds dramatically faster than the partial chain at length 100 (Fig. 3A, Right). Furthermore, whereas the full potential predicts that both folding rates drop with decreasing temperature, the native-only potential predicts that the folding rates remain constant or increase with decreasing temperature. These findings can be explained by two effects related to nonnative contacts, namely 1) the partial chain is normally stabilized by loose nonnative contacts, and so their absence leads to a reduced thermodynamic driving force for folding (SI Appendix, Figs. S1H and S2E), and 2) the absence of nonnative contacts eliminates kinetic trapping for the full protein at low temperatures. As a result, the folding rate now increases, rather than decreases with lowering temperature due to a stronger thermodynamic driving force. These observations point to the importance of nonnative interactions in producing the observed orders-of-magnitude slowdown in MarR folding rate in the full potential at lengths beyond 100 amino acids. Interestingly, although no nonnative frustration is observed in the native-only potential, we do observe the possibility of native topological frustration

There are hundreds to several thousand mitochondria present in every cell, where they normally have a life span of approximately 40 days before they are degraded

One of the major metabolic adaptations employed by cancer cells is the “Warburg effect” where mitochondrial oxidative phosphorylation (OXPHOS) is suppressed in favor of accelerated aerobic glycolysis [437], producing a toxic tumor microenvironment (TME) characterized by high alkalinity in the cytosol and high acidity in the extracellular environment resulting in an elevated alkaline intracellular pH (pHi) but an acidic, reduced extracellular pH (pHe) that can promote oncogenic properties [438,439]. This reversed pH gradient is widely accepted as the hallmark of cancers [440,441]. Cancer cells have been associated with higher values of pHi between 7.12 and 7.65 and a lower pHe of ~6.2–6.9, whereas pHi in normal cells is stringently maintained at a narrow range between 7.0 and 7.2, and pHe at ~7.4 [442,443,444,445,446,447,448,449]. In normal cells, metabolic and developmental transitions are highly dependent upon changes in pHi [450,451,452] and in silico studies showed that alkaline pHi, which is coupled to accelerated glycolysis and adaptation to hypoxia, maximized cancer cell proliferation, whereas reversing the pHi to normal acidic values prevented adaptations, halting tumor cell growth [453]. An acidic pHe in the TME is directly correlated to deficient oxygen supply from rapid cancer cell division and growth

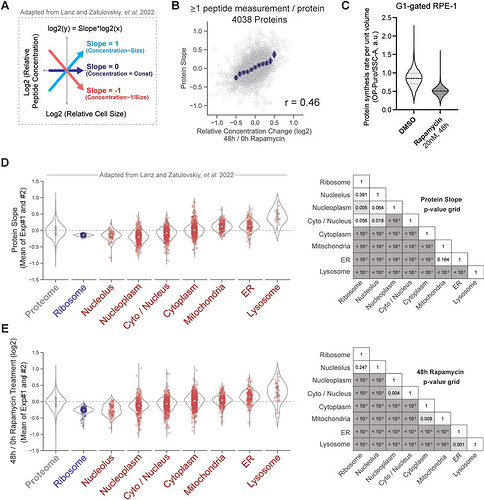
Markers of senescence whose concentrations increase with cell size (superscaling), including lysosomal proteins, also increased in concentration during rapamycin exposure. The subscaling proliferative marker, Ki67, decreased in response to rapamycin treatment too (Figure 5). However, some subscaling markers, such as HMGB1 and HMGB2, whose concentrations decrease in senescent cells and in large proliferating cells, remained at constant concentration during rapamycin treatment

https://twitter.com/i/lists/1577942103207907328 => physical cell biology list

pH of individual old cells spans a wide range of pH values from 7.8 to 5.7, and 36% of the cells maintain a pH above 7.5, which is the lower boundary in young cells. Comparing the old and young cells, our results show that the average cytosolic pH significantly decreases by 0.5 pH units in old cells, compared to young (Figure 1C), corresponding with previous findings (Knieß and Mayer, 2016).

We next asked how changes in cytosolic pH compare to those measured in the vacuole and cell cortex. Using the pHluorin2 (Mahon, 2011) and the same microfluidic design Crane et al., 2014, Chen and colleagues (Chen et al., 2020) measured the changes in vacuolar pH allowing comparison with our datasets (Figure 1—figure supplement 2E). From both studies, it is clear that the vacuole and cytosol change their pH in opposite directions during aging where the vacuole decreases in acidity and the cytosol becomes more acidic. An early life increase in cortical pH was reported previously (Henderson et al., 2014), which is the opposite of a decrease in the cytosolic pH observed in our long-term experiments. This apparent dichotomy prompted us to ask whether changes in the aging proteome can account for the distinct behavior of the cytosolic pH in relation to the vacuole and cell cortex. Indeed, in addition to the activity of proton pumps, the strong buffering capacity of metabolites and amino acid side chains contributes to pH homeostasis (Moriyama et al., 1992). Because the concentration of amino acids with a physiologically relevant pKa at protein surfaces is orders of magnitude larger than the concentration of free protons at pH 7 (protein concentration is in the mM-range while pH 7 corresponds to 60 nM H+), the proteome represents a buffer for changes in pH. Thus, we assessed the proteome isoelectric point (pI) during yeast replicative aging.

We utilized available datasets for protein abundance during aging (Janssens et al., 2015), predicted isoelectric point (Saccharomyces Genome Database, SGD), and protein copy number (Ghaemmaghami et al., 2003). We used data from 1229 proteins and corrected our calculations for relative protein abundance, thus weighing the proteome pI for the copy number of each protein. We found that in young cells, the proteome pI is 7.1, which accounts mostly for the cytosolic part of the cell, according to the Panther database for gene ontology. In cells aged for 60 hr (average replicative age ~22 divisions), the proteome pI reaches as low as 6.7 (Figure 1F). While this analysis carries uncertainties, for example related to protein pI predictions and age-related aggregate formation, it is striking that the proteome pI roughly follows the pH of the cytoplasm during aging. This suggests that additional to changes at the level of proton pumps, changes at the level of the buffering capacity of the proteome may underlie the decrease in cytosolic pH.

We previously developed a genetically encoded FRET-based probe that enables quantification of macromolecular crowding in vivo (Boersma et al., 2015). The sensor is genetically encoded, and it harbors a FRET pair, connected with a flexible linker. When placed in a crowded environment, the probe will obtain more compressed conformations, thus increasing the FRET efficiency

Plotting single-cell trajectories for cells that reach a replicative lifespan of 10, 10–15, 15–20, 20–25, or larger than 25 shows that the shortest-lived cells tend to increase the crowding levels during their lifespan, while the longer lived cells tend to have more stable crowding levels (Figure 3C). Indeed, there is a weak correlation (R2 = 0.14, p<0.001) between lifespan and old age crowding levels (Figure 3—figure supplement 1E), and the fold change in NFRET ratios in aging shows a weak correlation with lifespan (R2 = 0.22, p<0.001) (Figure 3D). In support of the relationship between crowding and aging, we observe that cells that live shorter than the average lifespan of 18 divisions have significantly higher ratios in aging (p<0.01), compared to long-lived cells (Figure 3E). It seems that it is the maintenance of crowding homeostasis, rather than the absolute crowding levels, which has an association with lifespan, as lifespan does not correlate to the crowding ratios in young cells (Figure 3—figure supplement 1F).

The average membrane-to-membrane distance in aged cells is >2 times smaller in aged cells than in a young cell: The average distance between organelles decreases from ~1000 to <500 nm. The distribution is, however, strongly tailing and these averages correspond to a change in the most common distance from 400–600 to 0–200 nm. Already from the frequency distribution of the measured inter-organelle distances that are smaller than 80 nm, which is ~12% in aged cells and ~2% in young cells, one could deduce that contact sites are possibly expanded in aged cells. The implications of an increase in membrane contact sites can be widespread. Moreover, the enlarged compartmentalization must affect the movement of larger structures such as ribosomes and induce confinement on similar-sized particles in the 40 nm range.

The organellar crowding should have several effects that are highly dependent on the local distance between the membranes and the size of the particle, as demonstrated by the time required to diffuse to the membrane (supporting information, Figure 4—figure supplement 3). The proximity to the membrane also increases the likelihood of interactions with membranes. The particles will also suffer an entropic cost by sacrificing translational degrees of freedom in the inter-organellar spaces. Hence, larger particles may be crowded out of regions with high organellar crowding leading to a size-dependent spatial sorting. On a technical note, given the extreme dependence on particle size, particles that are much smaller than the distance between the organelles would notice less of this confinement, which would include, for example, the macromolecular crowding sensor, which is polymer-like with a radius of ~5 nm

First, the physical property of organelle size drifts in aging: where the cytosol in young cells occupies most volume, followed by the nucleus and vacuole (Figure 4D left), in old cells the order is opposite: here the vacuoles are largest, and the cytosol represents the smallest volume fraction. In addition, the physicochemical property of pH changes in aging: where the pH of the vacuoles is kept much lower than the cytosol in young cells, their values come closer together as the cytosol acidifies (this study and Knieß and Mayer, 2016) and the vacuole loses acidity in aged cells (Chen et al., 2020; Hughes and Gottschling, 2012). Therefore, both in terms of size and pH, the vacuole and cytosol lose aspects of their compartmental identity. Lastly, crowding on the scale of organelles, which we term organellar crowding, sharply increases with aging. Organellar crowding likely influences phenomena that are on the 100 nm to µm length scale, such as long-range diffusion of larger particles and organelles, condensate formation, organellar shape, RNA translation, and cytoskeletal dynamics. Besides, the increased surface area presented by the organelles may give additional opportunity for adsorption or increased membrane contact sites. However, crowding at the length scale of a single protein, that is, ~10 nm, changes little, and these proteins do not experience a direct effect of organellar crowding

in animal cells, it has been proposed that changes in mitochondrial surface area-to-volume ratio and activity could emerge with changes in cell size due to network remodeling, although scant experimental evidence supports this hypothesis (Miettinen and Björklund, 2017). Moreover, how changes in mitochondrial morphology might relate to decreased expression of mitochondrial genes observed with increasing ploidy in animal cells and budding yeast (Sagi et al., 2016; Yahya et al., 2021

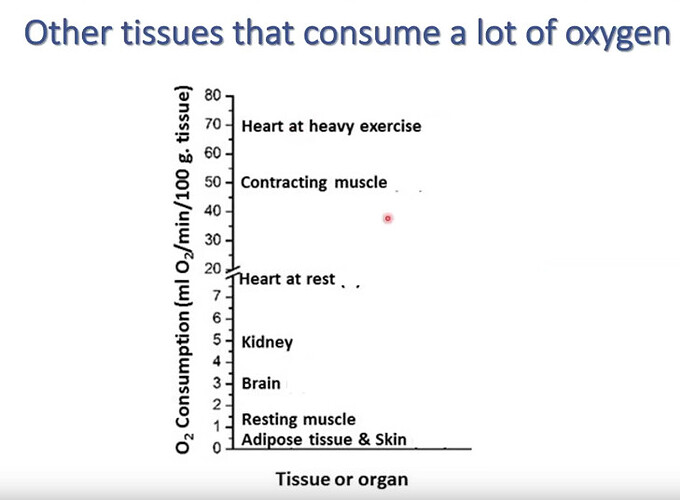
Neurons in brain: How Much Computational Power Does It Take to Match the Human Brain? - Open Philanthropy (not aging-relevant but cites SO MUCH)

If this post piqued your interest, I’d highly recommend Principles of Neural Design as an overview of our current knowledge of the brain. It starts from a bottom level of energy conservation and information theoretical limits, and builds on that to explain the low-level structures of the brain. I can’t claim to follow all the chemistry, but it did hammer home that the brain as far as we can tell is near maximally efficient at its jobs.

one could use these causal activity models to encode all observational and experimental knowledge about biological systems, including the immense amounts of genome-wide, single-nucleotide-resolution screening data currently being generated. The potential applications are immense:

The causal networks in GO-CAM models will also enable entirely new applications, such as network-based analysis of genomic data and logical modeling of biological systems. In addition, the models may also prove useful for pathway visualization…With GO-CAM, the massive knowledge base of GO annotations collected over the past 20 years can be used as the basis not only for a genomic-biology representation of gene function but also for a more expansive systems-biology representation and its emerging applications to the interpretation of large-scale experimental data.

The benefit of this sort of model is that it is extremely legible: the ontologies and relations are crystal clear, and every annotation points to the piece of scientific evidence it is based on. It is ordered, clean, and systematic.

https://www.biorxiv.org/content/10.1101/2021.08.27.457974v1 is full of them

we estimated an overall approximate 40% nonproductive RNAPII in gene bodies in 2-year-old liver in a gene-length-dependent fashion (Fig. 3i), which implies that they are stalled. Assuming that mouse hepatocytes have a similar number of RNAPII molecules per cell as cultured human fibroblasts33, we believe that the average 2-year-old mouse hepatocyte contains at any time >18,000 stalled RNAPII complexes during elongation (