Motivation: this is what we seek to preserve against the entropy induced by aging. Most of this is high-level and I don’t know if it give the most important additional insight on how to “solve” aging, but if you have content to integrate into your future LLM models, first-principles is still the most important thing for clear thinking [this is what LLMs are weakest at], and the content here is first principles
Peter Sterling’s Principles of Neural Design
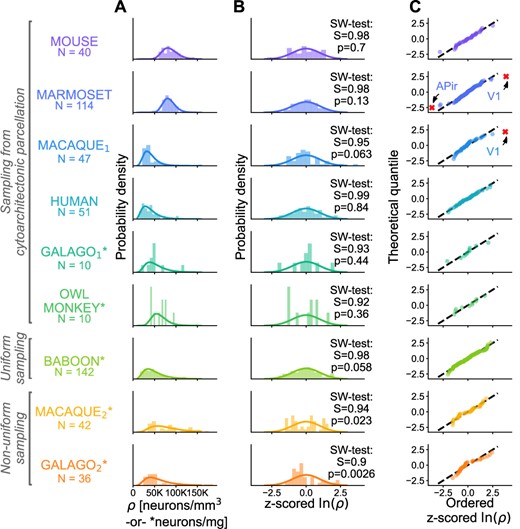
characterize the distribution of neuron densities ρ across mammalian cerebral cortex. Based on the sample histograms ([Fig. 1](javascript:;)) we hypothesize that ρ follows a lognormal distribution, similar to many other neuroanatomical and physiological variables ([Buzsáki and Mizuseki 2014](javascript:;)) such as synaptic strengths ([Robinson et al. 2021](javascript:;)), synapse sizes ([Loewenstein et al. 2011](javascript:;); [Santuy et al. 2018](javascript:;); [Dorkenwald et al. 2022](javascript:;)), axonal widths ([Wang et al. 2008](javascript:;); [Liewald et al. 2014](javascript:;)), and cortico-cortical connection densities ([Markov et al. 2014](javascript:;); [Gămănuţ et al. 2018](javascript:;)). We used neuron density data from mouse (Mus musculus), marmoset (Callithrix jacchus), macaque (Macaca mulatta), human (Homo sapiens), galago (Otolemur garnettii), owl monkey (Aotus nancymaae), and baboon (Papio cynocephalus anubis) to test this hypothesis (see Section Cell density data for a detailed description of the data). The marmoset, galago, owl monkey, baboon, and macaque2 data sets are based on a single subject; the mouse, macaque1
, and human data sets are based on a combination of data across several subjects. The statistical tests conclude that the hypothesis cannot be rejected in the majority of cases, suggesting that the underlying distribution is compatible with a lognormal distribution if the samples are based either on cytoarchitectonically defined areas or on uniformly sampled regions. Beyond the distribution across cortical areas, we show that neuron densities within most areas of marmoset cortex are also compatible with a lognormal distribution. To complement the statistical tests, we perform a model comparison with several other distributions and find that none outperform the lognormal distribution as a model of the data within and across areas. Finally, we show that the lognormal distribution within cortical areas can emerge during neurogenesis from a simple cell division model with variability. The model can furthermore account quantitatively for the lognormal density distribution across areas based on an inferred distribution of proliferation times of the areas. Additional between-area variability in the proliferation rates is also compatible with the model but not necessary to obtain a quantitative agreement with the observed distribution. Thus, our model shows how the lognormal distribution of neurons could emerge both within and across the cortical areas.
Fig. 1