Fitbit Takeout deep-dive: HRV trends + device/wrist regime changes (Charge 2 vs Charge 5 era) — and a data-availability PSA
Ran a regime-change analysis on my own Fitbit export today. Nothing shocking clinically, but the device-switch effects are a nice cautionary tale for anyone doing long-horizon wearable trends, and there’s a Takeout gotcha at the end worth knowing.
Setup
- Minute-level steps:
Global Export Data/steps-*.jsonsummed per day (2011 → Sep 2024, 2,945 days) - Nightly HRV:
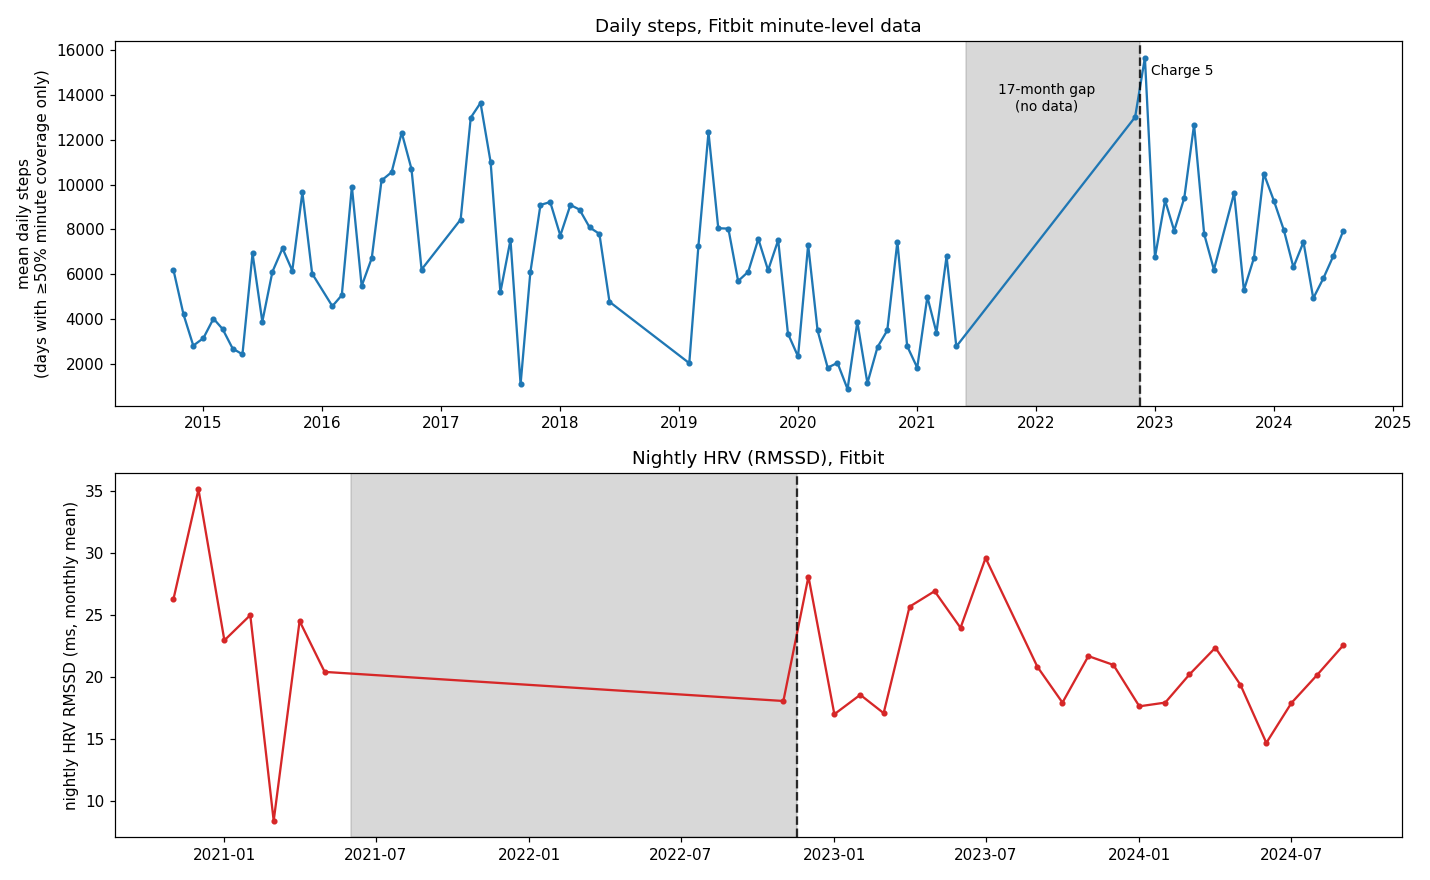
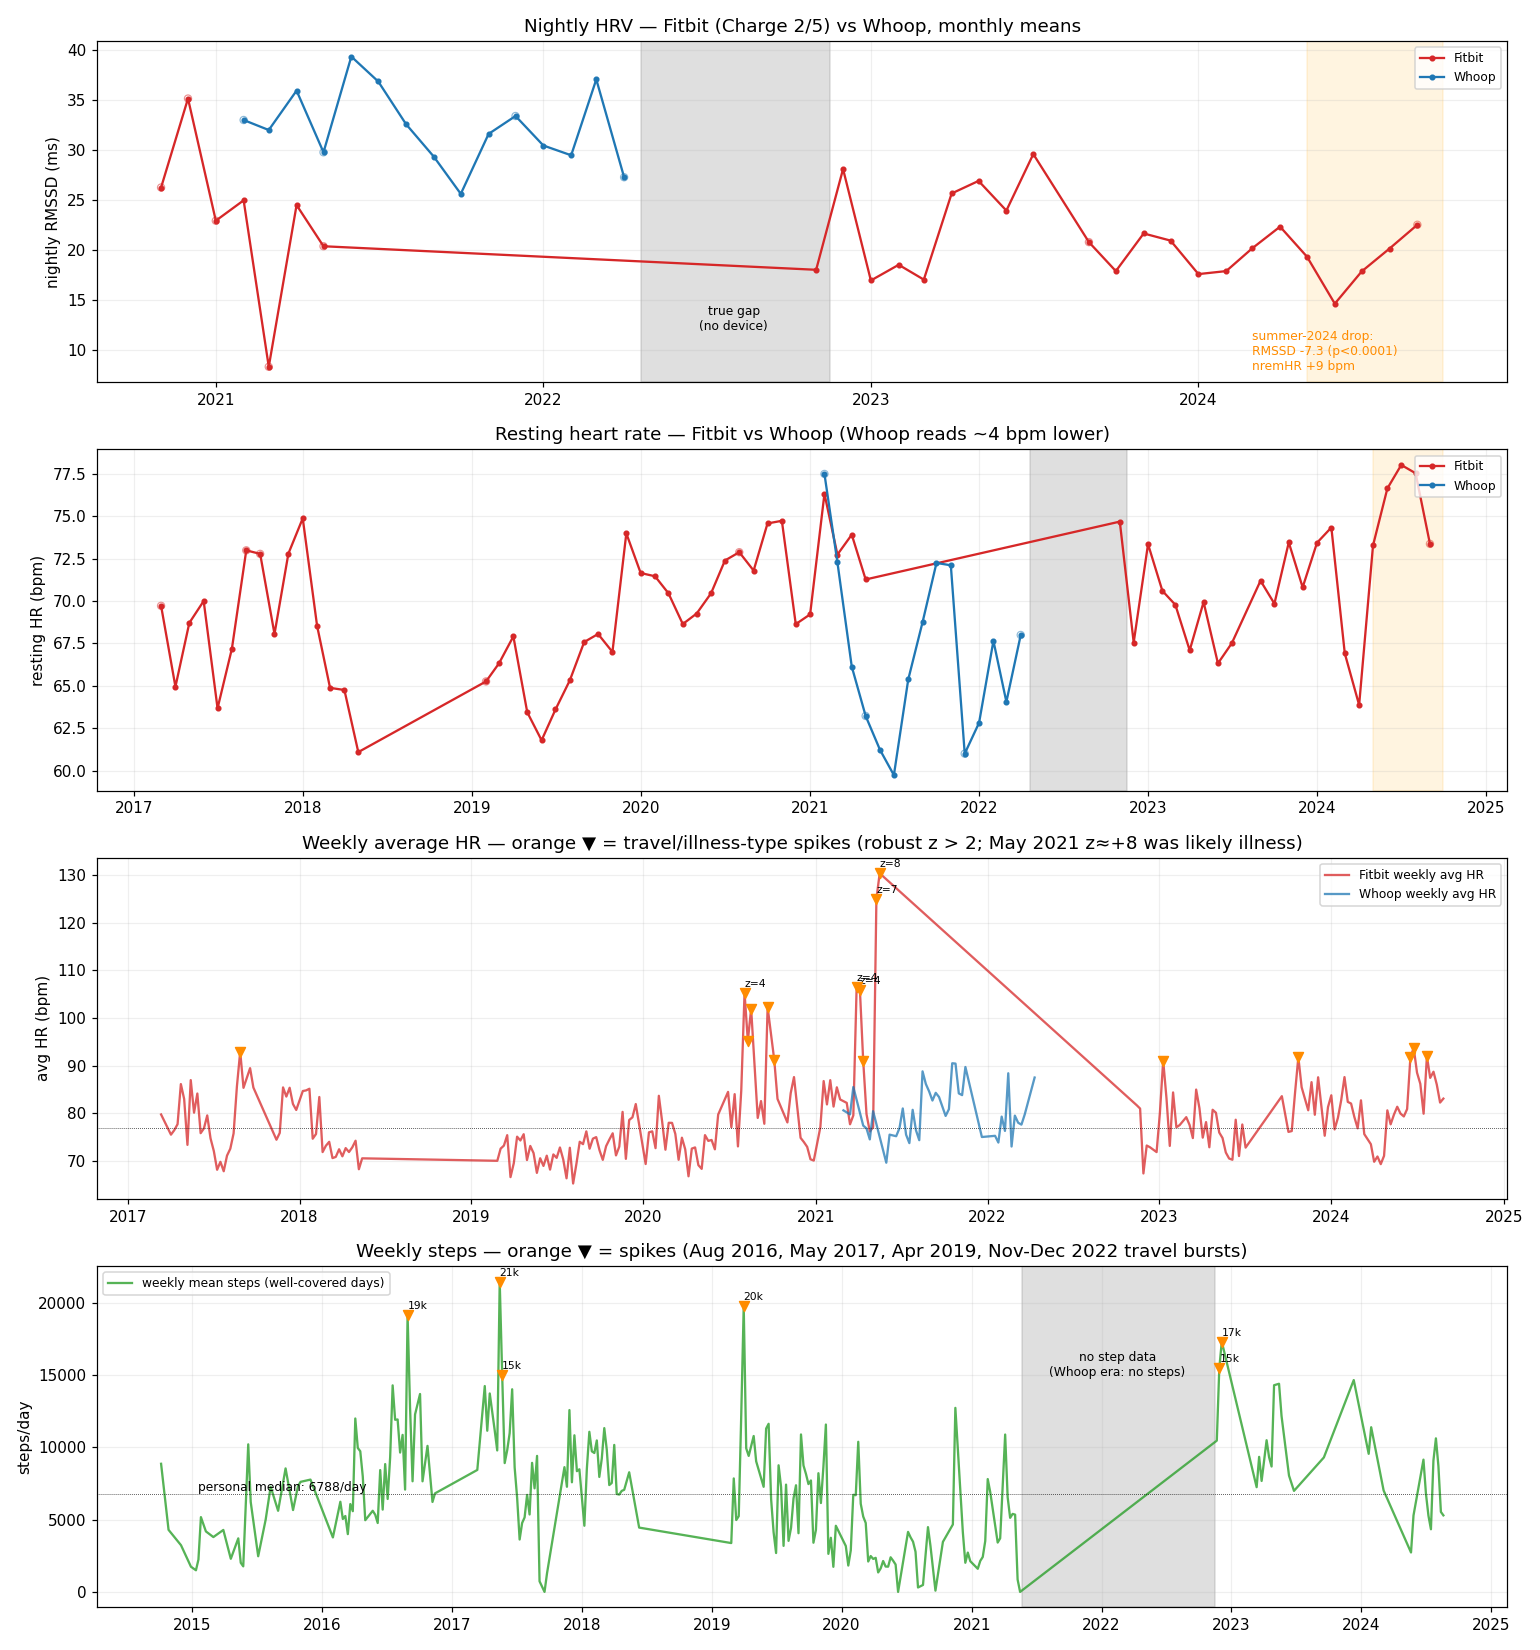
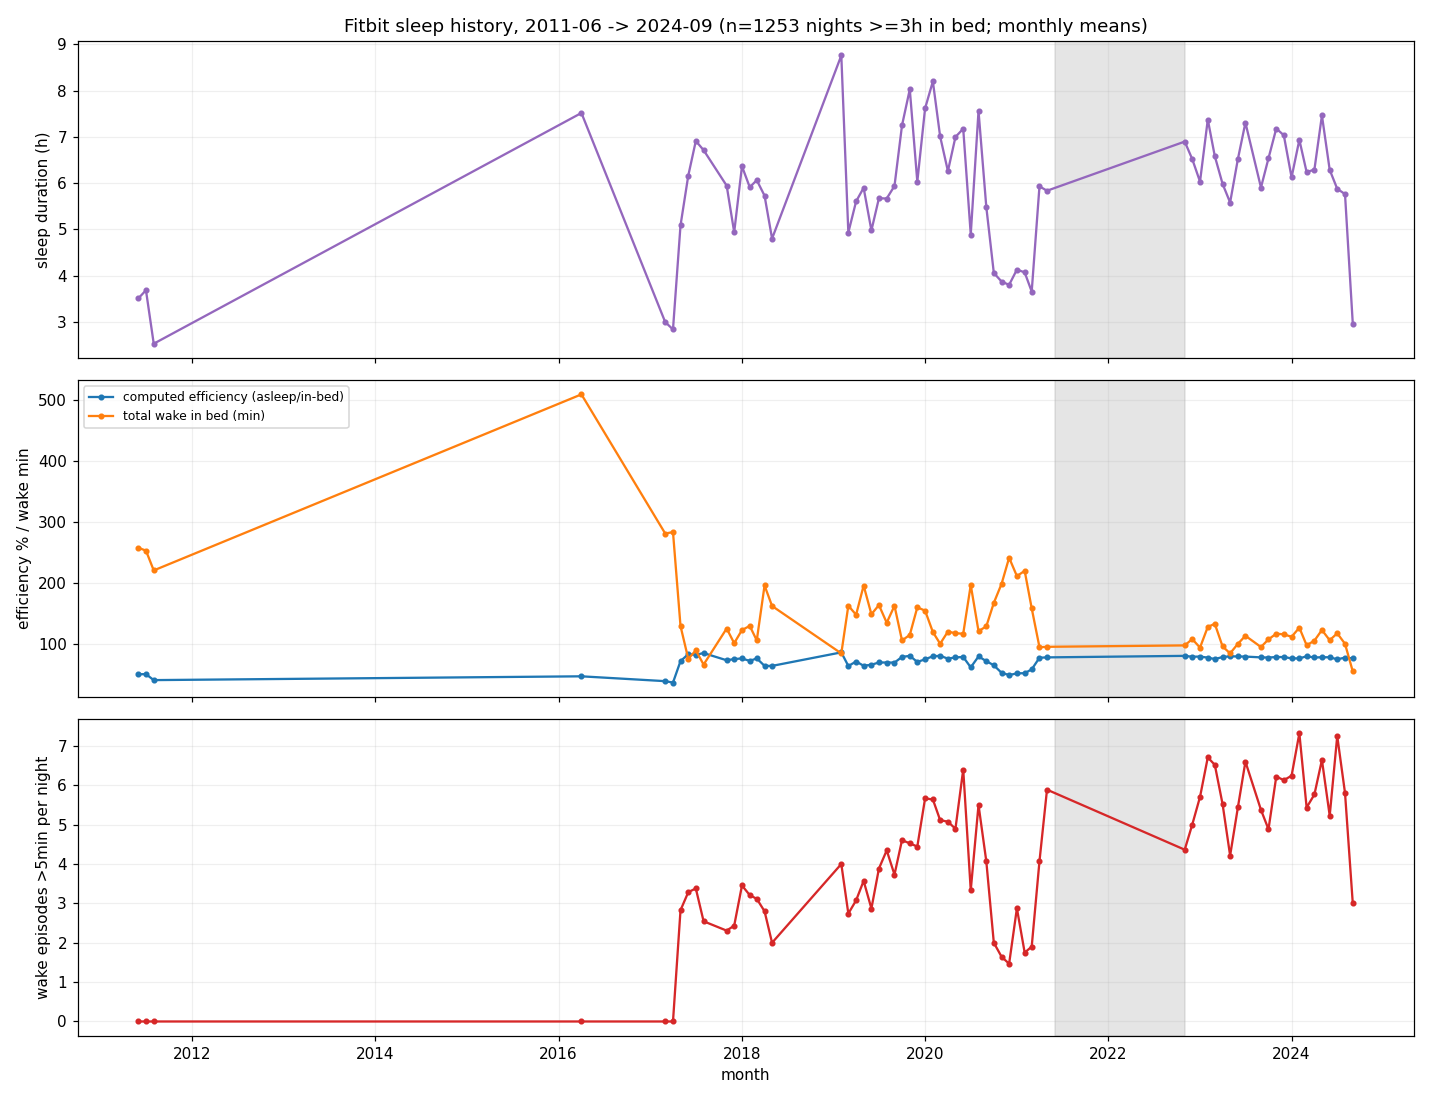
Heart Rate Variability/Daily Heart Rate Variability Summary*.csv(RMSSD, nremhr; 521 days, Nov 2020 → Sep 2024) - Devices on record: Ultra → Charge 2 → Charge 5. 17-month total data gap Jun 2021 → Nov 2022 (device-less period).
- Changepoint detection: binary segmentation on daily means (|z| > 3), plus Welch t / Mann-Whitney on era windows.
The key artifact-metrics lesson: sync coverage bias
Raw era comparison is misleading:
| era | n | mean steps |
|---|---|---|
| Charge 2 (all) | 2,383 | 6,304 |
| Charge 5 (all) | 562 | 5,865 |
…but restricting to days with >=50% minute-coverage (i.e. days the tracker was actually worn/synced all day):
| era | n | mean steps |
|---|---|---|
| Charge 2 | 1,374 | 6,517 |
| Charge 5 | 243 | 8,432 |
Partial-wear days bias step totals down, and the effect size differs by device era. If you don’t filter on coverage, device comparisons are mostly noise. (Charge 5 era had much sparser sync coverage, so 8,432 is likely an overestimate — direction is robust, level is not.)
Steps: real regime change across the device switch (confounded with life changes)
- Charge 2 late era (2019-01 → 2021-05): mean 5,161/day (n=636 well-covered)
- Charge 5 era (2022-11 → 2024-09): mean 8,432/day (n=243 well-covered)
- Welch t = -3.45, p = 0.0006 — a genuine level shift, though a 17-month gap separates the eras, so it’s confounded with whatever happened in between (life, COVID-era, etc.)
- Biggest binary-segmentation changepoints: 2019-11-25 (z=11.5), 2021-02-15 (z=11.2, drop into COVID-era low), 2024-02-07, 2024-06-26.
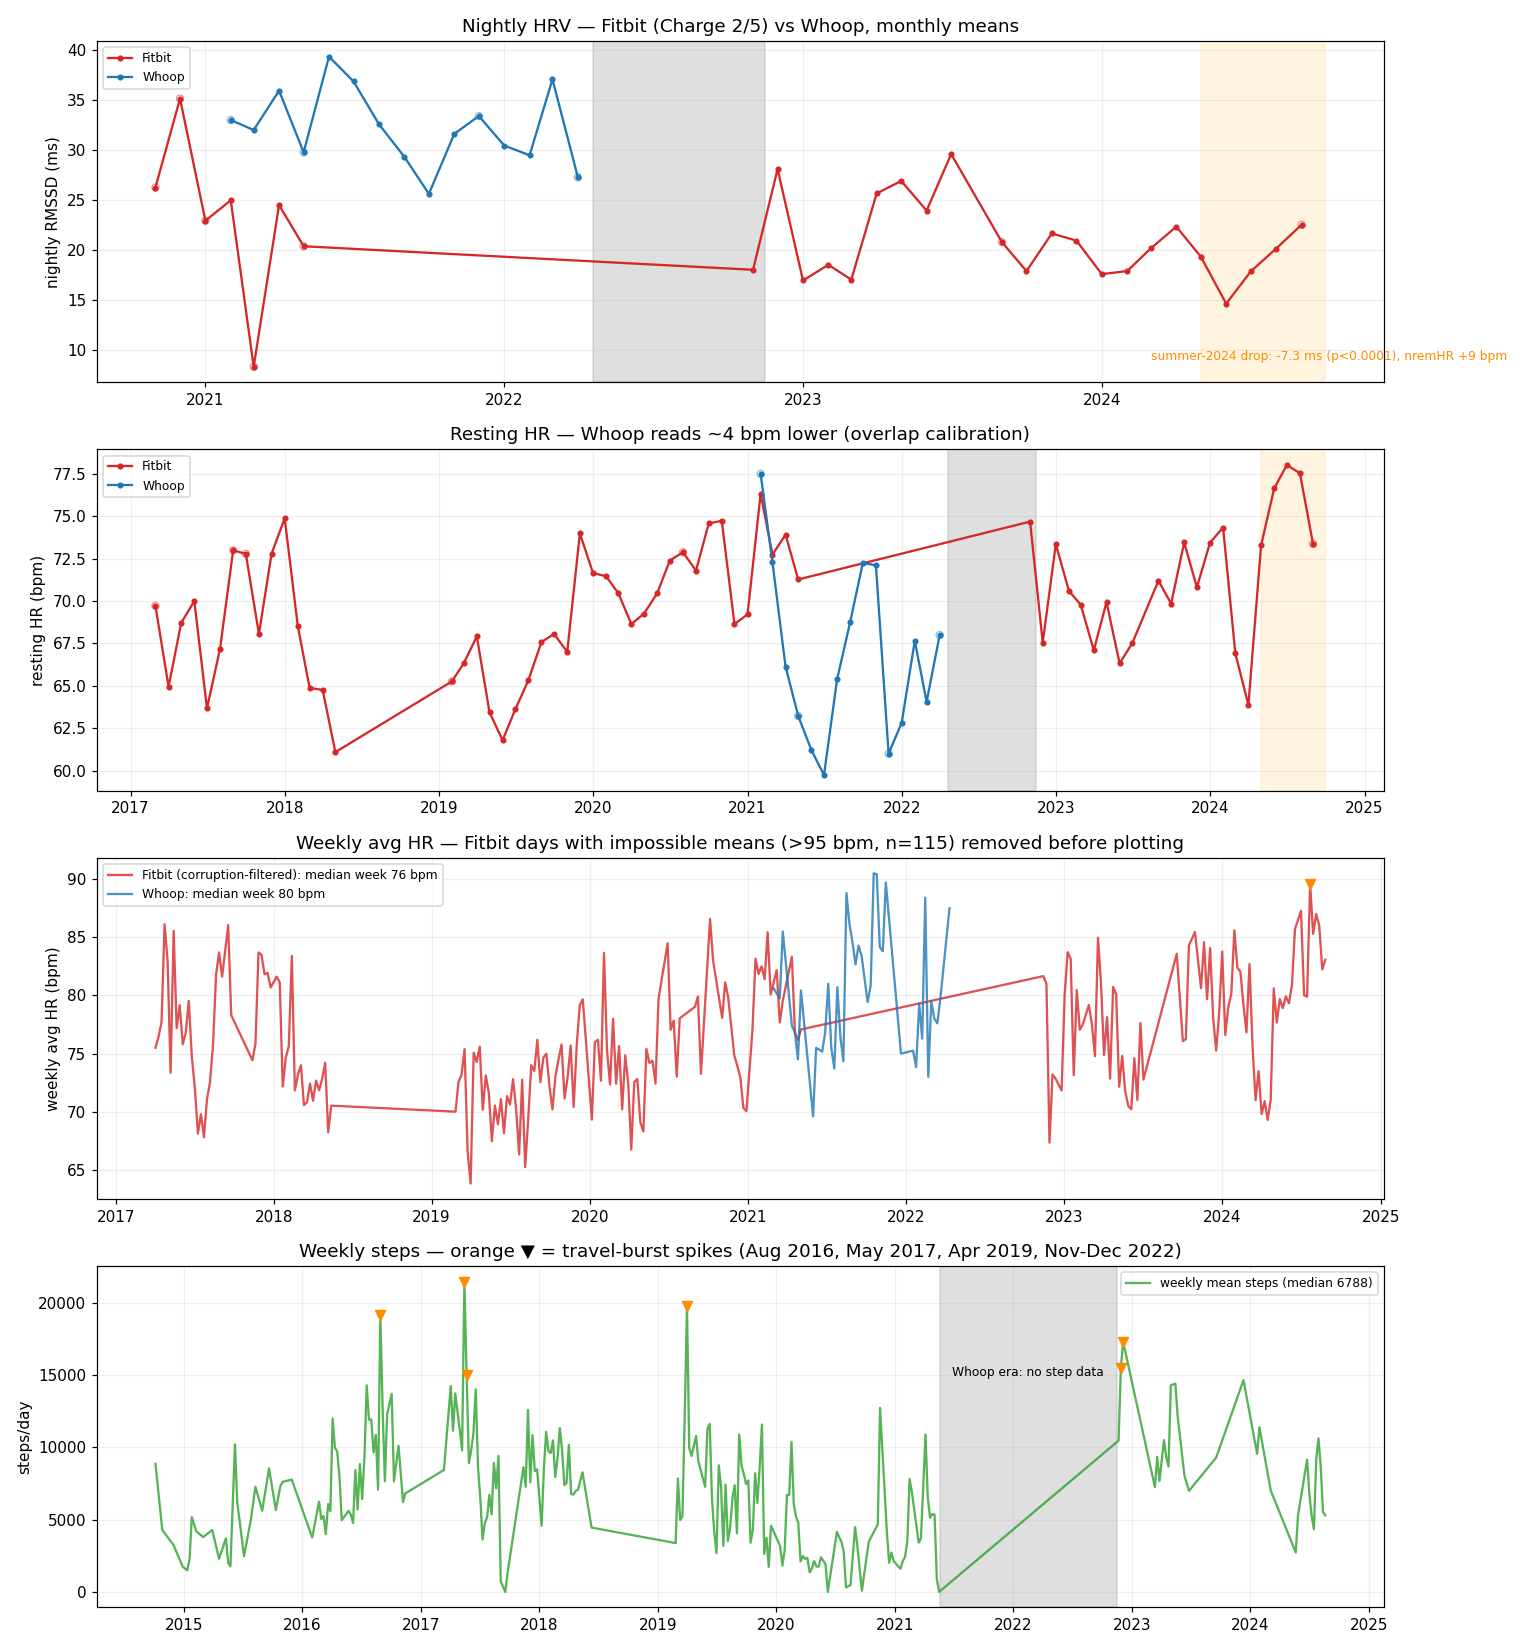
HRV: seasonal sawtooth over a slow decline (through Sep 2024)
| period | n | RMSSD | nremHR |
|---|---|---|---|
| 2020-11 → 2021-05 (Charge 2) | 48 | 23.1 | 62.7 |
| winter 2022-23 | 134 | 20.6 | 65.7 |
| summer 2023 | 88 | 24.1 | 63.6 |
| winter 2023-24 | 178 | 19.9 | 68.0 |
| Jun → Sep 2024 | 73 | 17.8 | 73.1 |
Same-season comparisons (summer 2023 → summer 2024): RMSSD 24.1 → 17.8, nremHR 63.6 → 73.1. Within-device (Charge 5 only), so no device confound — a real downward drift through mid-2024. (Caveat: nightly RMSSD on wrist is noisy and device-firmware-sensitive; but the RHR rise alongside it is the more trustworthy signal.)
The Takeout gotcha (PSA)
Google Takeout’s “Fitbit” and “Fit” are separate products. I recently exported with only Fit checked and got zero Fitbit device data (Google Fit steps from my old Samsung phone end in 2017). If you want the full wearable archive — minute-level steps, nightly HRV, SpO2, ECG, sleep score — you must tick the Fitbit product explicitly. It exports as minute-level JSONs + per-day CSVs, and it’s the only place long-horizon device data lives.
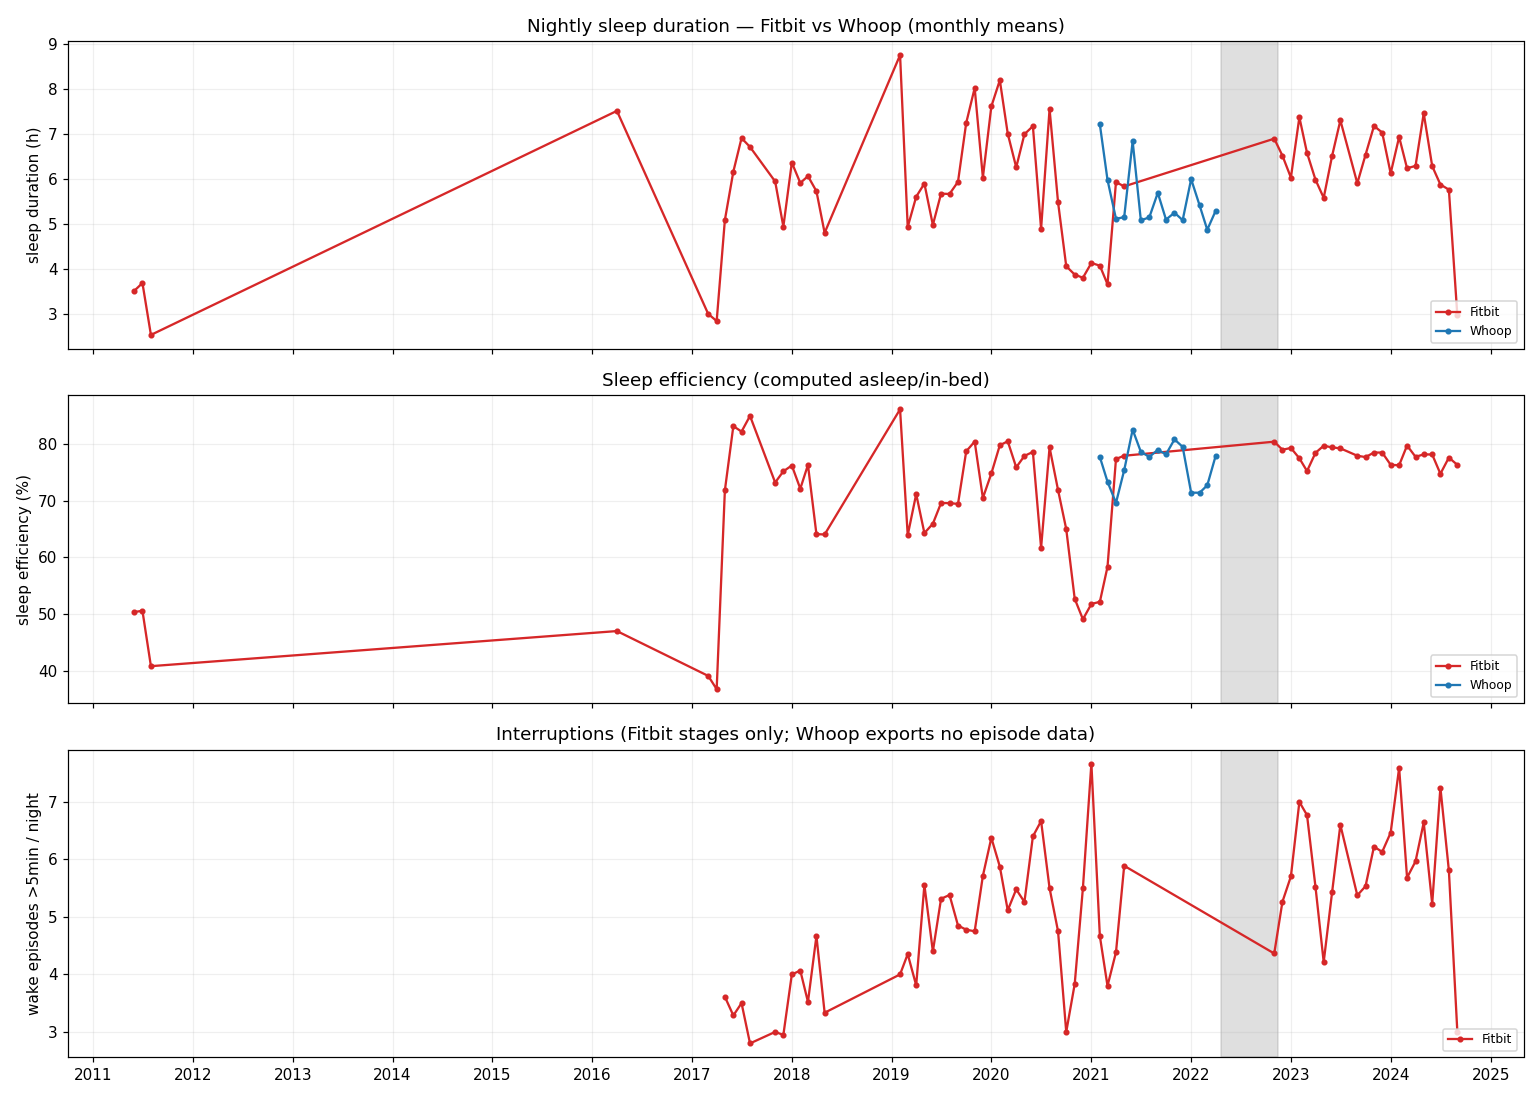
Chart of both series (monthly means, coverage-filtered steps) attached in the replies.
Analysis scripts: Python, minute-JSONs → daily sums, binary segmentation changepoint, Welch/Mann-Whitney on era windows. Happy to share the scripts if anyone wants to run their own export through the same pipeline.
Question for the crowd: has anyone here compared RMSSD across a device migration (e.g. Charge → Charge 6, or Fitbit → Oura/Whoop) and managed to separate the true physiology from the algorithm/firmware change? My n=1 says the coverage bias alone is worth a 30% swing in apparent daily steps.